
Kavyashree Byalya
Nanjegowda
AI Software Engineer | M.Sc. Digital Engineering
I’m an AI/ML focused software engineer with 4+ years of industry experience delivering automation, agentic systems, and production-ready engineering solutions.I’m pursuing an M.Sc. in Digital Engineering at Otto-von-Guericke University Magdeburg, with a focus on Machine Learning, Data Engineering, and intelligent systems.In my current working-student role, I contribute across software development and quality engineering, while designing and integrating AI capabilities, especially AI-driven multi-agent workflows to strengthen product reliability and impact.Previously, I worked nearly 3 years at Accenture as a Software Engineer, where I strengthened my experience in software development and quality engineering by developing features, supporting production releases and escalations, and collaborating cross-functionally in Agile release cycles.I’m currently seeking roles as an AI Engineer, Machine Learning Engineer, or AI Automation Engineer, and I’m also open to Data Scientist positions focused on deploying practical AI in real-world applications.
Skills
LLM & agentic systems: RAG, LangChain, LangGraph, CrewAI, n8nMachine Learning & Deep Learning: Scikit-learn, PyTorch, TensorFlow, MLFlowProgramming Languages: Python, Java, TypeScript, JavaScriptFrontend: React, Material UI, StorybookBackend & APIs: FastAPI, REST, Swagger, DockerData & databases: PostgreSQL, SQL/MySQL, SQL; Vector stores: ChromaDB, FAISSTesting & quality: Playwright, Jest, JMeterLanguages: German(B1), English(C1)
Projects
These projects showcase my work across AI/ML, Data Analytics, and software engineering where I turn ideas into reliable, working systems. I take projects end-to-end, from problem framing and data preparation to modeling, evaluation, and delivery through interactive dashboards or deployed prototypes. You'll find reproducible ML workflows, explainable results, and clean implementation focused on real-world impact. Each solution is built to solve a specific problem, validated with data, and designed for clarity and usability.
Thank you for taking the time to explore my portfolio!
If you think I could be a good fit for your team, I’d love to connect. You can reach me via email or LinkedIn, or use the form below.
© Untitled. All rights reserved.
AI-Powered Test Automation Agent
Built a multi-agent system that generates structured test cases and executable Playwright scripts directly from natural language prompts. Users provide a target app URL and test description through a React-based web UI, which triggers a crewAI agent pipeline to explore the app, generate test cases, let users select specific scenarios, produce TypeScript Playwright specs, and auto-fix failing tests up to 3 times.Tools: Python, crewAI, FastAPI, OpenAI API, Playwright, Playwright MCP, React, TypeScript, Vite, Tailwind CSS
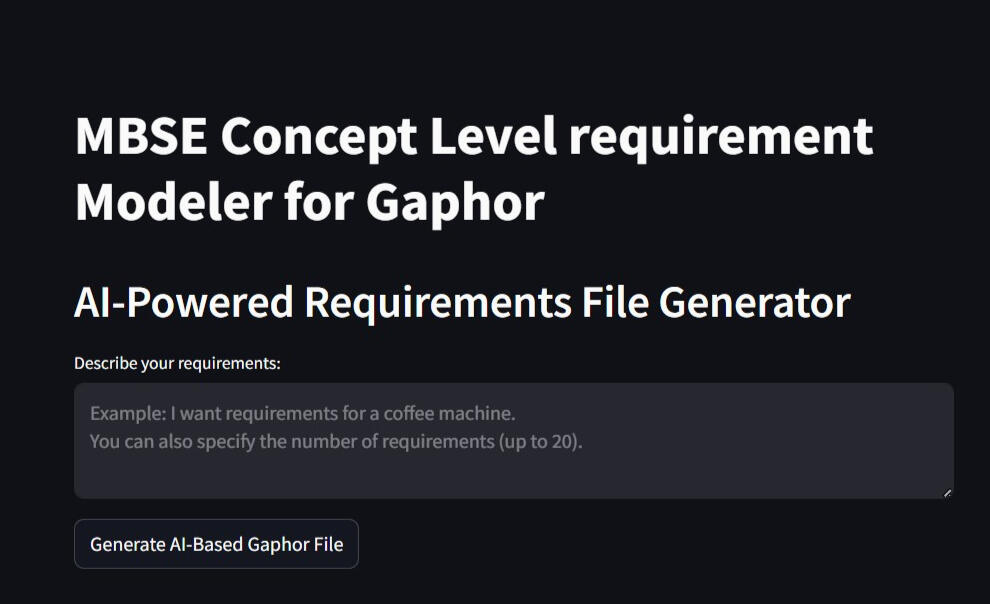
MBSE Requirements Automation with LLM
Developed a natural language-driven system to assist in automating the requirements modeling stage of Model-Based Systems Engineering (MBSE) for manufacturing systems. Designed an intuitive Streamlit interface that enables subject matter experts to input system descriptions in plain language. Leveraged the Perplexity API to convert unstructured text into structured JSON, which was then used to generate SysML requirement diagrams using Gaphor.Tools: Python, Streamlit, Perplexity API, Gaphor
Feature Importance Analysis for Energy Forecasting in CNC Machines
Implemented advanced feature attribution techniques to identify key drivers of energy consumption in CNC machine operations. Compared Gradient-based (Integrated Gradients), Removal-based (Permutation), Model-based (WinIT), and Local Explanation (LIME) methods across LSTM, GRU, XGBoost, and Random Forest models. Visualized and interpreted feature relevance from time series data to drive actionable insights for energy optimization.Tools: Python, Scikit-learn, NumPy, Pandas, Streamlit, TensorFlow
Cloud-Based Machine Learning Pipeline for Market Forecasting and Analysis
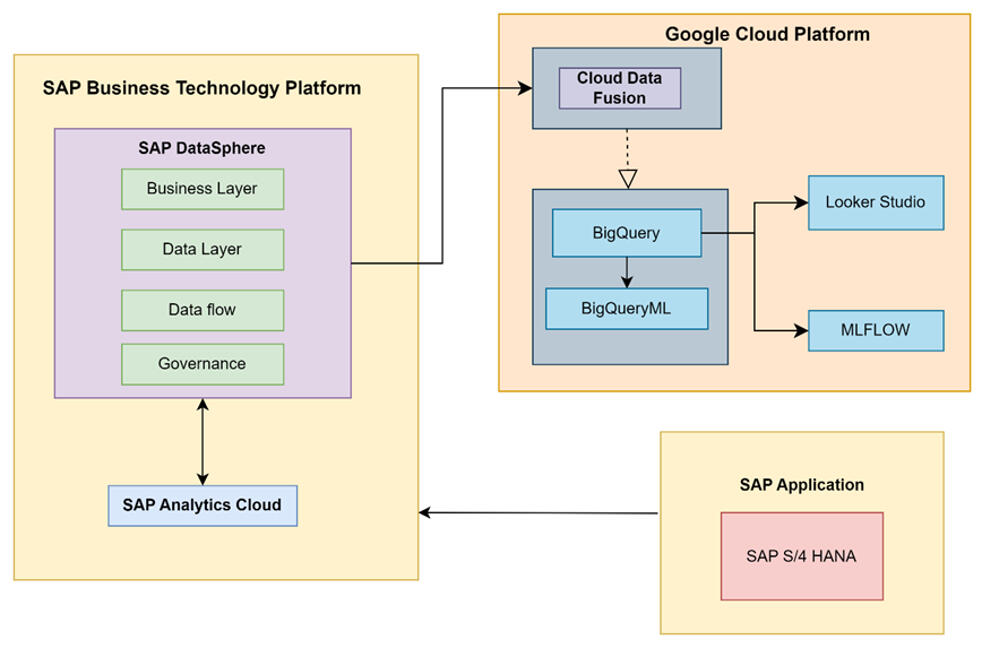
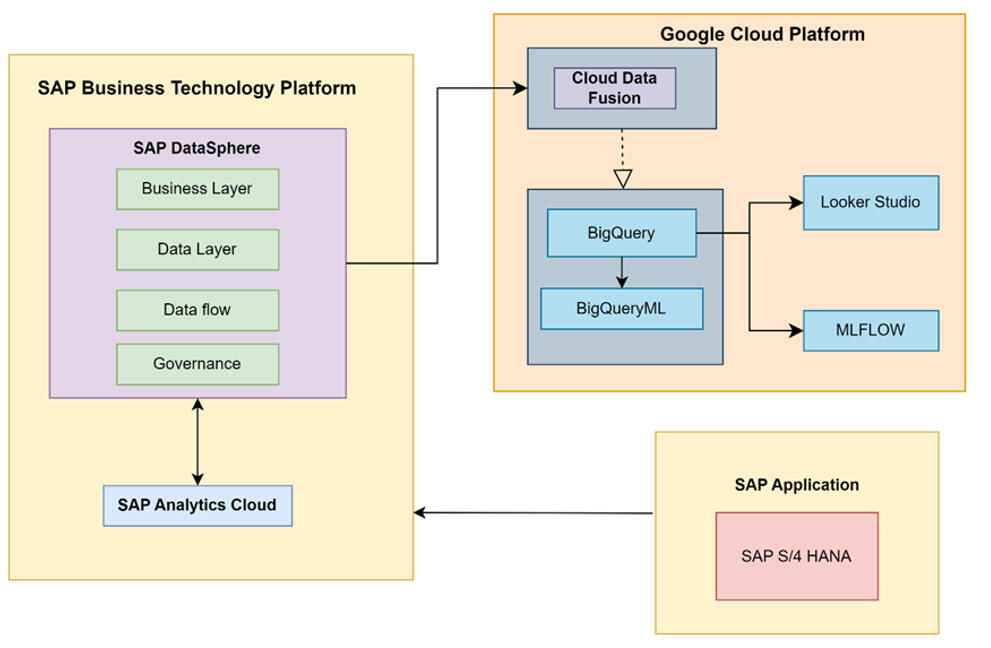
Built an end-to-end, cloud-based machine learning pipeline for market segmentation and demand forecasting for mobility products. Integrated enterprise data from SAP Datasphere into BigQuery and performed data preparation and modeling in BigQuery ML using K-means for segmentation and ARIMA_PLUS for sales and material requirement forecasting. Used MLflow to track experiments and manage runs for reproducible model development. Delivered interactive dashboards in Google Cloud Looker Studio to communicate forecasts and support business decision-making.Tools: Google Cloud Platform (BigQuery, BigQuery ML, Looker Studio), SAP Datasphere, MLflow, Python, SQL
Sales and Profit Dashboard in Power BI
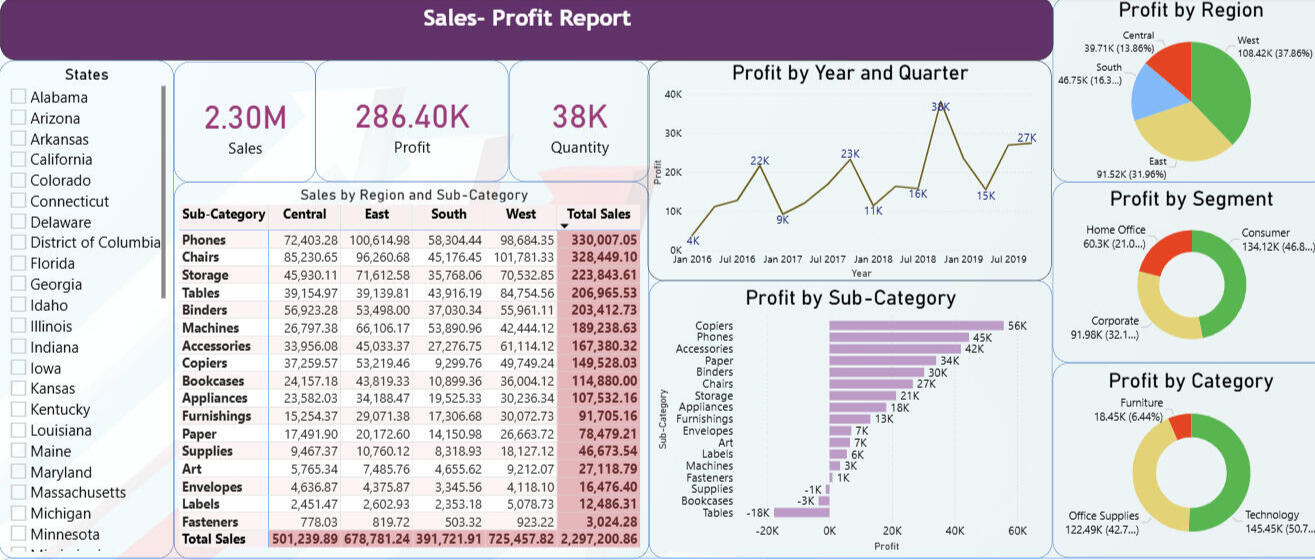
Built an interactive Power BI report on a multi-year U.S. superstore dataset to analyze sales and profitability by region, customer segment, and product category. Enabled self-serve analysis using KPI cards, slicers, drilldowns, and time-series views to surface profit drivers and loss-making areas.Tools: Power BI Desktop, DAX, Power Query, Excel (dataset)
Interactive 3D Rotary Calciner Simulation for Process Engineering Education
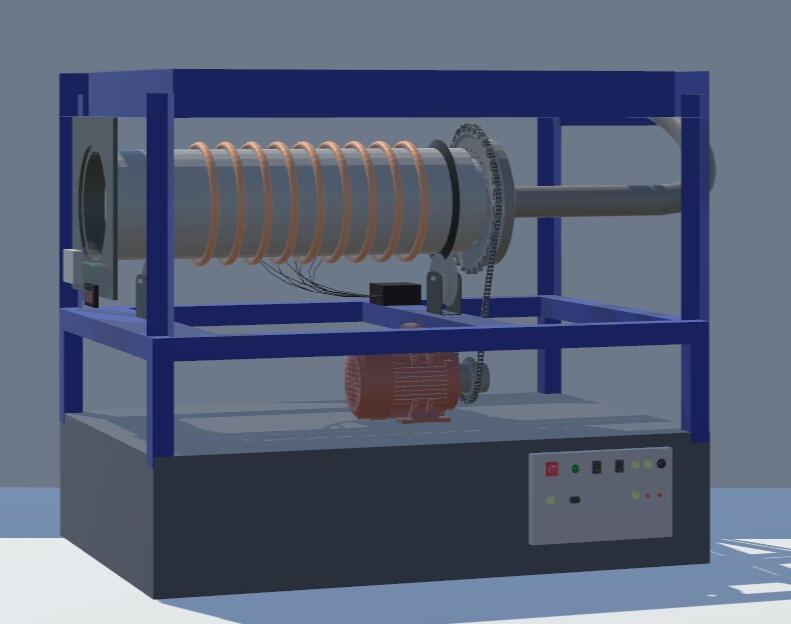
Developed “Calciner Quest,” a Windows-based Unity 3D educational application, in collaboration with Chemical and Energy Engineering students, to visualize an internal rotary calciner and simulate key process behavior through guided scenes and interactive 3D exploration. Implemented a maintainable architecture with clear documentation, using Singleton, Entity-Component-System, and Decorator patterns to structure dialogue, audio, animation, and camera controls.Tools: Unity 3D, C#, Blender, SolidWorks, AutoCAD
MBSE Requirements Automation with LLM
Project Overview
This project was developed in collaboration with the Systems Engineering Department, OvGU, as part of my Master’s program, and builds a natural-language-driven assistant that helps automate the requirements modeling stage of Model-Based Systems Engineering (MBSE) for manufacturing systems.Domain experts can write system needs in plain English, and the system converts that text into a structured model that can be opened and edited as a SysML requirements diagram in Gaphor.Problem Statement
Manufacturing requirements are typically captured informally in natural language by domain experts, but converting them into formal SysML requirement models presents several obstacles:
1. The process is time-intensive and demands MBSE tool expertise, creating accessibility barriers for non-specialists.
2. Manual diagram creation in specialized tools slows down early-stage system design and iteration.
3. Maintaining and updating requirement sets across project lifecycles requires efficient workflows that blend automation with manual control.Solution & Implementation
Built a multi-workflow Streamlit application offering three distinct pathways for requirements model creation and management:
1. Direct Input Workflow: Users define up to 20 requirements by specifying titles and descriptions, which the system converts into a downloadable .gaphor file ready for immediate use, streamlining the process for those familiar with writing requirements but unfamiliar with modeling tools.
2. Natural Language Processing Workflow: Users describe system requirements conversationally, and the Perplexity AI backend parses the input to generate structured, concept-level SysML requirements and exports them as industry-standard diagrams, abstracting away technical complexity.
3.Model Update Workflow: Users can upload existing .gaphor files and perform create, read, update, and delete operations on requirements through an intuitive interface, enabling iterative refinement without manual diagram manipulation.The backend architecture ensures seamless Gaphor integration through carefully engineered XML generation, LLM prompt design following ISO 15288 and MBSE best practices, and structured JSON intermediate representation to maintain consistency.Impact & Value
1. Significantly reduced the technical barrier to producing standards-compliant MBSE diagrams, democratizing requirements engineering for diverse user groups.
2. AI-driven automation accelerates early requirements specification while maintaining structural integrity and reducing manual modeling errors.
3. Native Gaphor file format support ensures smooth integration with existing MBSE workflows and downstream design activities.Using the Application
1. Go to the Project Repository and follow the README steps to launch the Streamlit app locally.
2. Choose workflow:
- Direct Input: Manually specify requirements and download the model file.
- AI Generation: Describe requirements in natural language and let the system generate the SysML diagram.
- Model Editing: Upload an existing file to add, modify, or remove requirements.
3. Download: Retrieve your generated or updated .gaphor file.
4. Visualize: Open the file in Gaphor to view and continue refining your requirements diagram.Gaphor installation: Download from https://gaphor.org/download/ for Windows or Mac.Future Scope
This prototype can be extended beyond concept-level requirements to generate additional SysML artifacts such as activity and structure diagrams, while maintaining traceability between requirements, functions, and components. It can also be expanded with multilingual input and broader export support to integrate with additional MBSE tools and evolving standards such as SysML v2 workflows.
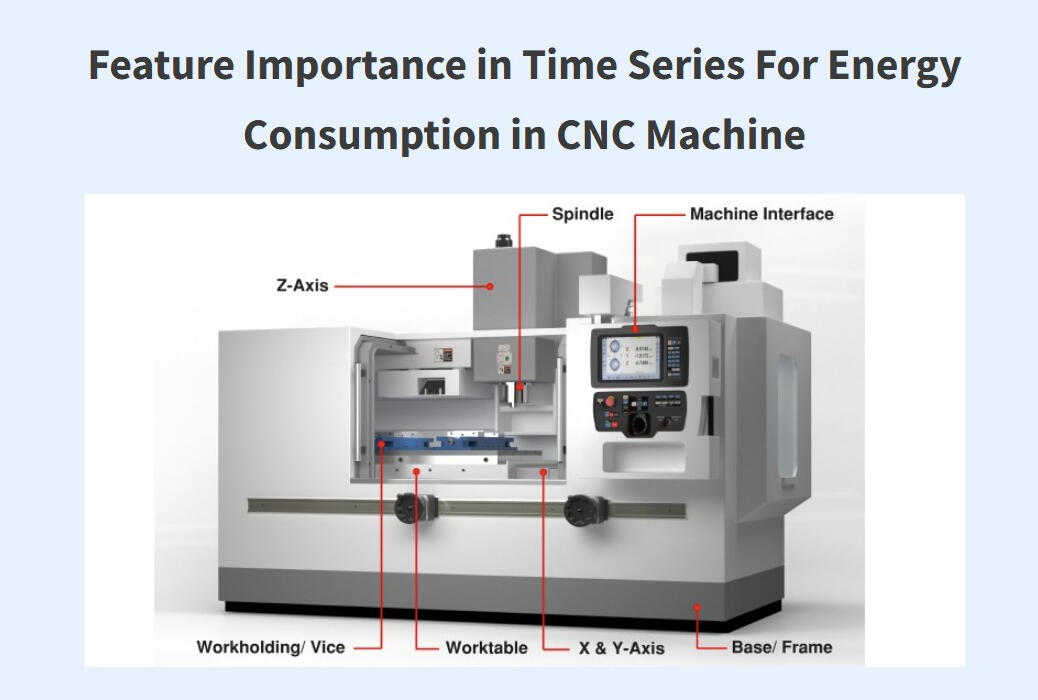
Feature Importance in Time Series For Energy Consumption in CNC Machine
Overview
This project was completed in collaboration with the Autonomous Multi-sensor Systems (AMS) group at Otto von Guericke University (OvGU) as part of an AMS lab project, focusing on feature importance in time series for CNC machine energy consumption. The work used real CNC sensor logs and multiple machine learning models together with explainability techniques - Integrated Gradients (IG), WINIT, LIME, and Permutation Importance to identify which operational signals most influence energy usage and support energy-efficient manufacturing.Problem Statement
1. Which process and sensor variables most influence CNC energy-consumption under different machining conditions?
2. How do feature-importance methods differ in accuracy, runtime, and explanation usefulness for industrial time-series data?
3. How can results be made accessible through an interactive interface so engineers can explore explanations across scenarios?Approach and Methodology
1. Dataset Preparation and Preprocessing
- Used Four real-world time-series datasets collected from a DMC2 CNC machine: DMC2ALCP1, DMC2ALCP2, DMC2SCP1, DMC2SCP2 (Aluminum/Steel × CP1/CP2).
- Removed irrelevant/constant columns (e.g., CYCLE, ADBD0, unused POWER channels).
- Dropped 28 columns containing missing values (NaNs).
- Excluded inactive axis features and retained 52 relevant features tied to active axes and spindle.
- Standardized inputs and normalized targets to support stable training.
- Ran two experimental settings: with and without correlation-based filtering (removed highly correlated features) to study redundancy effects. All modeling and explainability runs were executed offline and outputs (metrics, plots, top features) were stored for consistent comparison and later surfaced in the app.2. Feature Importance Techniques Implemented
Integrated Gradients (IG): Gradient-based attributions for differentiable models (applied to FNN/LSTM).
WINIT: Windowed time-series attribution capturing temporal and delayed effects (applied with LSTM and also explored with XGBoost).
LIME: Local surrogate explanations, evaluated across models including LSTM, Random Forest, and XGBoost.
Permutation Importance (PI): Shuffle-based importance measured by performance drop, used with tree models (Decision Tree, Random Forest).3. Evaluation and Comparison
Compared methods using test loss, execution time, and interpretability and stability of top-ranked features across scenarios.4. Streamlit Application
- Packaged the experiment results into an interactive Streamlit dashboard. The UI supports comparisons across dataset scenarios and explainability methods, including plots and ranked feature lists.
- The user can Select a method (IG/WINIT/LIME/PI) and scenario (material/program), then inspect feature rankings and metric trade-offs instantly.Key Findings1. Feature rankings vary across scenarios and techniques, so comparing multiple explanation views is important for industrial datasets.
2. Integrated Gradients with an FNN and correlation filtering provided a strong overall balance between accuracy, runtime, and interpretability across datasets.
3. Signals related to torque/load and control deviations appeared consistently among influential drivers of energy-consumption patterns.How to Use the App1. Open the dashboard link.
2. Choose a technique (IG / WINIT / LIME / Permutation) and a dataset scenario (material/program).
3. Review the ranked features and compare trade-offs using test loss and execution time.Future Scope
The current app displays precomputed feature-importance outputs, but the same setup can be extended for industrial use by adding a CI/CD pipeline and dataset upload. This would automate preprocessing, model evaluation, and explanation generation, turning the dashboard from a static viewer into a scalable, continuously updated analytics tool.
Cloud-Based Machine Learning Pipeline for Market Forecasting and Analysis
Project Overview
This project was completed as part of the VLBA – System Architectures course at Otto von Guericke University (OvGU), focusing on building an end-to-end cloud-based machine learning pipeline for manufacturing and product distribution analytics. Working with real enterprise data from SAP Datasphere, developed a comprehensive forecasting solution that integrated geographical customer segmentation, sales prediction, and material requirements planning to support strategic business decisions for a global mobility products manufacturer.Problem Statement
1. Which geographical markets show the highest customer concentration and revenue potential to guide strategic resource allocation and marketing investments?
2. What are the expected product sales volumes for the next 5-7 years to enable proactive production planning and reduce inventory holding costs?
3. What material quantities will be required to meet forecasted demand to optimize procurement strategies and prevent supply chain bottlenecks?
4. How can these insights be delivered through interactive dashboards so business stakeholders can explore scenarios and make data-driven decisions in real-time?Approach and Methodology
1. Data Integration and Architecture Setup
- Established cloud infrastructure connecting SAP Datasphere with Google Cloud Platform using Cloud Data Fusion for automated data transfer.
- Configured MLflow tracking server on GCP for experiment management and model versioning.2. Data Preparation and Cleaning
- Extracted 10+ years of historical data (50K+ records) from SAP Datasphere covering customers, orders, products, and materials.
- Fixed data quality issues: imputed missing values and corrected encoding errors.
- Enriched customer data with latitude and longitude coordinates using Google Maps Geocoding API.3. Geographical Market Clustering
Applied K-Means clustering on customer coordinates to identify distinct geographical market segments and analyzed revenue patterns.4. Sales Forecasting with ARIMA PLUS
-Built ARIMA PLUS time-series models in BigQuery ML using European market data.
-Generated 7-year forecast and specific year predictions for production planning.5. Material Requirements Forecasting
- Mapped sales forecasts to material requirements.
- Built ARIMA_PLUS models for material consumption forecasting.6. MLflow Orchestration
- Logged all experiments, models, forecasts, and evaluation metrics to MLflow for reproducibility.
- Tracked parameters (countries, periods, models) and metrics (AIC, variance, confidence intervals).7. Interactive Dashboard Development
- Built 3 Looker Studio dashboards: Geographical segmentation (maps, revenue charts, Product sales) , forecast ( trends, market share, Material requirements( breakdown, 5-year demand).
- Enabled real-time scenario exploration for business stakeholders.Key Takeaways
1. Integrating enterprise systems (SAP) with cloud analytics (GCP) creates a scalable foundation for end-to-end ML pipelines, from data ingestion through forecasting to interactive visualization for manufacturing decision-making.
2. Geographical clustering helped decide on targeted resource allocation and market-specific strategies for maximum business impact.
3. Product-level forecasting identified divergent trends: High-growth products warrant increased production capacity, while declining products require strategic intervention or phase-out decisions.
4. Material requirements forecasting shifts procurement from reactive to proactive, reducing inventory costs and preventing supply chain bottlenecks through data-driven planning.
4. The cloud-native architecture with MLflow orchestration ensures reproducibility and scalability, providing a robust platform extensible to other product lines, markets, and real-time optimization scenarios.Future Scope
The current batch forecasting solution can be extended to real-time optimization by incorporating external factors such as economic indicators, weather, and competitor pricing, and by building streaming pipelines for live inventory updates, with automated model retraining triggered by data drift. API endpoints could expose forecasts to enterprise systems (ERP, CRM) for seamless integration. Long-term, the infrastructure supports AI-powered decision automation for production scheduling, dynamic pricing, predictive maintenance, and sustainability metrics integration across the entire supply chain.
Interactive 3D Rotary Calciner Simulation for Process Engineering Education
Project Overview
This project was developed in collaboration with the Institute of Process Engineering at Otto von Guericke University (OvGU) and focuses on creating an interactive 3D visualization application for process engineering education, replicating the university's pilot plant rotary calciner, enabling students to explore complex industrial equipment and understand the calcination process through immersive digital interaction.Problem Statement
1. How can complex industrial equipment be made accessible for student learning when physical access to pilot plants is limited and traditional lectures lack hands-on experience?
2. What level of detail and interactivity is needed to help students understand both the structural components and operational processes of a rotary calciner?
3. How can the calcination process be visualized dynamically, showing material movement, thermal decomposition stages, and component interactions in real-time?Approach and Methodology
1. Requirements Gathering and Technical Specifications
- Conducted site visits to OvGU's pilot plant calciner, taking detailed measurements and photographs.
- Documented calciner specifications, analyzed thermal decomposition process, and calculated simulation parameters.2.3D Modeling and Asset Creation
- Created precise component models using SolidWorks for complex mechanical parts (motor, chain drive, girth gear with 33 teeth).
- Developed visual models in Blender for drum structure, support rollers, heating coils, and control systems.
- Exported models as .fbx format for Unity integration, ensuring proper scaling and texture mapping.3. Unity Application Development
- Implemented Entity-Component-System (ECS) architecture for modular, scalable code structure.
- Developed core management classes: DialogueManager (22 guided scenes), AnimationManager (particle physics), AudioManager (synchronized narration).
- Created dual interaction modes: Guided learning path with narrative dialogue, Free 3D exploration with mouse/slider controls (zoom, rotation).
- Built ButtonControlScript for consistent navigation (Home, Next, Back, Skip buttons across all scenes).4. Physics-Based Simulation
- Programmed for realistic drum rotation synchronized with motor and girth gear movement.
- Implemented gravity and collision physics for authentic material tumbling inside a rotating drum.5. Interactive Learning Features
- Components Explanation Mode: Individual component highlighting with technical specifications and educational descriptions
Simulation Mode: Full operational cycle showing material loading, drum rotation (RPM-controlled), heating activation, particle movement.6. Software Development Lifecycle
- Applied Agile methodology with iterative development, regular supervisor feedback sessions, and continuous refinement.
- Conducted user testing with engineering students to validate educational effectiveness and usability.Key Takeaways
- Cross-disciplinary collaboration between Computer Science and Chemical Engineering can produce effective tools, combining technical modeling expertise with domain-specific process knowledge.
- Dual interaction paradigms (guided vs. exploratory learning) address different user needs, supporting both structured curriculum delivery and self-directed investigation.
- Design patterns (Singleton, ECS, Decorator) ensure maintainability and extensibility, allowing easy addition of new components, processes, or simulation scenarios in future iterations.
- 3D visualization bridges theory-practice gap in engineering education, enabling students to understand complex equipment operation before encountering physical systems in industry.Future Scope
The current application focuses on batch calcination of aluminum hydroxide and can be extended with variable process parameters allowing users to adjust temperature profiles, rotation speeds, and material properties to observe different calcination outcomes. Multi-material support could include limestone, magnesite, and petroleum coke calcination processes with material-specific thermal behavior. Integration of real-time data visualization showing temperature graphs, moisture content curves, and energy consumption metrics would strengthen quantitative learning. VR/AR deployment would provide truly immersive experiences, while assessment modules with quizzes and simulation challenges could measure learning outcomes and provide automated feedback for self-paced education.
Sales and Profit Dashboard in Power BI
Project Overview
This project, developed as part of the Data Visualization course at the Visualization Group, Otto-von-Guericke University, presents an interactive Power BI dashboard built on a multi-year U.S. superstore sales and profit dataset sourced from Kaggle. It enables users to analyze profitability by region, customer segment, product category, and time, using clear visuals and an intuitive, exploratory layout. The focus is on advanced, interactive reporting that makes it easier to spot performance patterns and business drivers.Problem Statement
1. How can superstore retail data be visualized in a way that clearly surfaces sales and profit insights across customer groups, product categories, and geographic regions?
2. What profit patterns emerge over time, and how do they differ across regions and product sub-categories?
3. Which customer segments drive the most profit, and which categories show sustained revenue performance?
4. How can an interactive dashboard support fast, self-service exploration of complex, multi-dimensional sales data for better decision-making?Methodology and Steps
Dataset:
The selected Kaggle dataset emulates realistic retail transactions, making it suitable for meaningful business analysis and visualization with below features:
- Roughly 9,994 records covering the years 2016–2019.
- All measures are in USD.
- Key fields include customer segment (Consumer, Corporate, Home Office), product categories and sub-categories (Furniture, Office Supplies, Technology), shipping mode, order date, geographic attributes (50 U.S. states grouped into four regions), sales, quantity, and profit.1) Data preparation and cleaning
- Imported the dataset and reviewed structure, data types, and field definitions.
- Performed quality checks on date ranges, categorical consistency, and validity of sales/profit values to ensure reliable reporting.2) Power BI dashboard design
Built a set of visuals to analyze performance from multiple angles, including:
- Pie charts for regional profit share.
- Donut charts for profit split by customer segment and product category.
- Bar charts to compare profit across product sub-categories.
- Line charts to track profit trends by year/quarter.
- Tables for detailed sales and profit figures.
- Slicers (e.g., state) and KPI cards to support quick filtering and high-level performance summaries.
The report is designed to support drill-down and cross-filtering for deeper analysis.3) Interactivity and user experience
- Enabled interactive exploration through slicers, hover tooltips, and visual cross-highlighting.
- Organized the layout to make navigation straightforward and to help users move from overview KPIs to detailed breakdowns.Key Takeaways
1. The dashboard provides a consolidated view of sales and profit across time, geography, and product structure to support data-driven decisions.
2. Multiple visual perspectives help identify strong-performing regions and categories, as well as sub-categories that may be unprofitable.
3. Customer segmentation analysis shows how different buyer groups contribute differently to profitability.
4. Interactivity (filters and drill-down) improves exploratory analysis and enables customized views without rewriting reports.How to view the Dashboard
1. Download the Power BI report (.pbix) from GitHub
2. Open it using Power BI Desktop (free Microsoft application).
3. Use slicers and interactive visuals to explore profit and sales across states, regions, segments, and product lines.
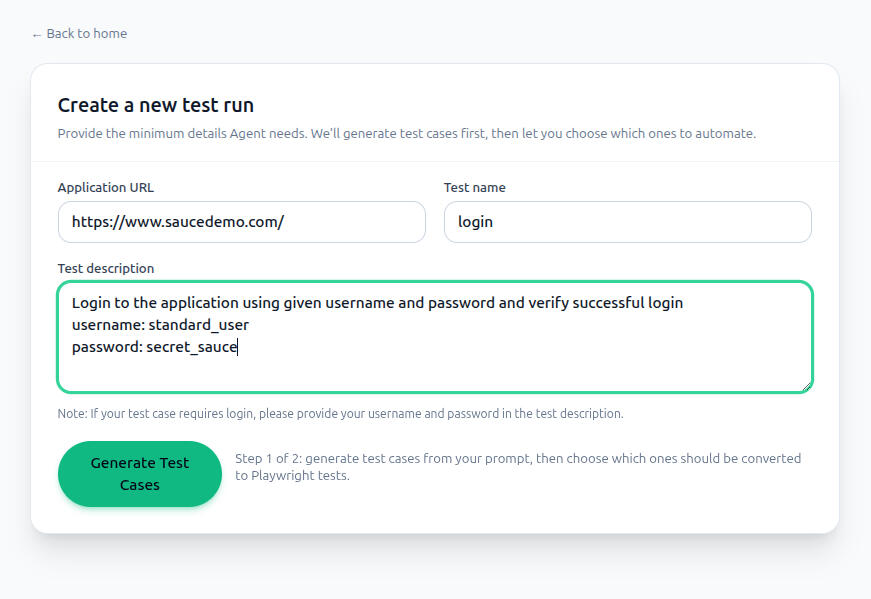
AI-Powered Test Automation Agent
Project Overview
This project builds a natural-language-driven system that enables users to generate structured test cases and executable Playwright automation scripts from plain English descriptions. By simply providing a target application URL and a short test description, the pipeline automatically explores the app, reasons about testable behaviors, and produces ready-to-run TypeScript test scripts with a self-healing mechanism that attempts to auto-fix failures before surfacing results.Problem Statement
Writing automated UI tests is one of the most time-consuming and skill-dependent tasks in software QA:
1. Translating feature requirements into structured test cases requires both domain knowledge and QA expertise, creating a bottleneck for developers and non-QA team members.
2. Even with generated test cases, maintaining and updating them as the application evolves still demands manual effort and an understanding of the underlying test logic.
3. Authoring and debugging Playwright scripts requires familiarity with browser automation APIs, TypeScript, and asynchronous patterns, technical barriers that slow down test coverage and delay fixes when scripts break.Solution & Implementation
Built a full-stack agentic application with a two-step generation workflow powered by a crewAI multi-agent pipeline:- Test Case Generation (Step 1): The user provides a target app URL, test name, and description. A dedicated exploration agent browses the live application using Playwright MCP to understand its structure and interactions. A test cases generator agent uses those observations to generate structured, human-readable test cases presented in the UI for review.- Script Generation & Execution (Step 2): The user selects which test cases to automate. A script-generation agent produces a TypeScript Playwright spec for the selected cases. An execution agent runs the tests and, on failure, triggers up to 3 automated fix attempts using LLM-driven self-correction before finalizing results.- Artifact Downloads: After each run, users can download the Playwright script, test cases in Markdown and JSON, exploration data, and an AI-generated run report, enabling integration with existing CI/CD pipelines or further manual refinement.The backend is built on FastAPI with Server-Sent Events (SSE) for real-time log streaming, and the frontend is a React + Vite + Tailwind CSS application. All agent orchestration is handled by crewAI with OpenAI as the LLM provider.Impact & Value
1. Lowers the barrier to UI test automation by letting anyone regardless of Playwright or TypeScript expertise, generate and run browser tests from natural language.
2. The self-healing execution loop reduces the manual debugging cycle, improving test reliability without developer intervention.
3. Structured artifact outputs (scripts, reports, JSON test cases) make the tool compatible with existing QA workflows and documentation practices.Using the Application1. Go to the Project Repository and follow the README to set up and launch the application.
2. Enter your target app URL, test name, and description, then click Generate Test Cases.
3. Review the generated test cases, select the ones you want automated, and click Generate Script.
4. Monitor live progress in the status panel (toggle technical logs for detailed output).
5. Download your Playwright script, test case files, and run report from the artifacts panel.Future Scope
The agent pipeline can be extended to support additional testing frameworks beyond Playwright (e.g., Cypress, Selenium), multi-page flow coverage with state tracking across sessions, and integration with CI/CD tools like GitHub Actions for fully automated regression testing. Support for visual regression testing and accessibility checks could also be layered in as additional specialized agents within the crewAI workflow.